
|
|

|

|


Student's t-distributions were discovered by William S. Gosset (1876-1937) in 1908 when he was working for the Guinness brewing company in Dublin (Ireland). He could not publish his discoveries using his own name because Guinness prohibited its employees from publishing any papers with confidential information. He then wrote under the pen name "Student". Gosset had a good relationship with Karl Pearson, who had been his teacher. He needed a distribution that he could use when the sample size was small and the variance was unknown and has to be estimated from the data. The t-distribution is often used to account for the extra uncertainty that results from this estimation. Fisher appreciated the importance of Gosset's work with small samples.
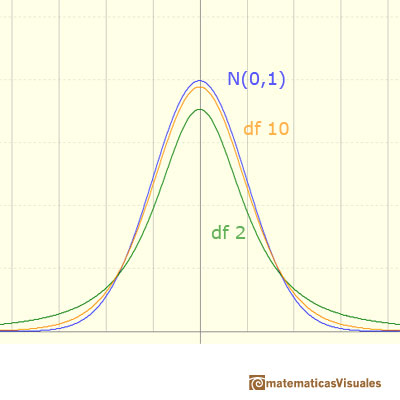
If the sample size is n then the t-distribution has n-1 degrees of freedom. There is a different t-distribution for each sample size. It is a class or family of continuous probability distributions. The t density curves are symmetric and bell-shaped like the standard normal distribution. Its mean is 0 and its variance is bigger than 1 (it has heavier tails. The tails of the t-distributions decrease more slowly than the tails of the normal distribution). The larger the degrees of freedom, the closer to 1 is the variance and more similar is the t-density to the normal density.
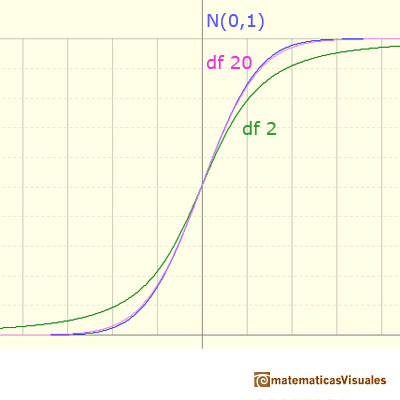
With n larger than 30, the difference between the normal and the t-distribution is really not very important. In the image we can see several examples of cumulative distribution functions:
In Probabilities in Student's t-distributions you can see a more precise comparation between Student's t-distributions and the standard normal.
In the applet we can see several examples of Student's t-distributions and the standard normal distributions.
We can see that when the degrees of freedom is 25 the t-distribution is very similar to the standar normal.
The gray points control vertical and horizontal scales. Pressing the right button and dragging you can move left and right.
LINKS


