
|
|

|

|


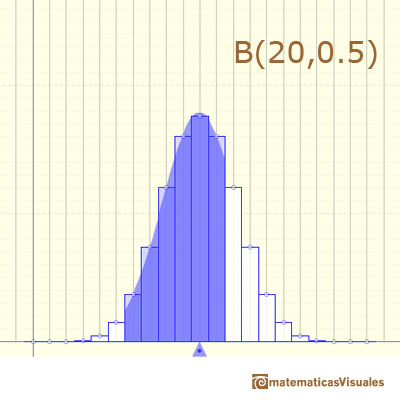
In some cases, a Binomial Distribution can be approximated by a Normal Distribution (with the same mean and variance).
If X is a random variable with a Binomial Distribution we can write:
Then, if Y is a random variable with a Normal Distribution with the same mean and variance:
We can use two approximations. First, we can use the normal mass function: (in the applet this is the orange line)
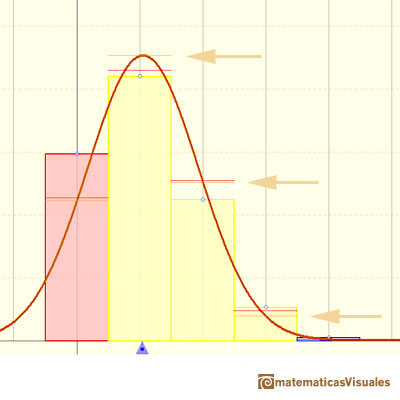
A second approach is better and more practical if we use the tables of a normal distribution. Now we use a continuity correction, for example:
In the applet, this approximation is the red line.
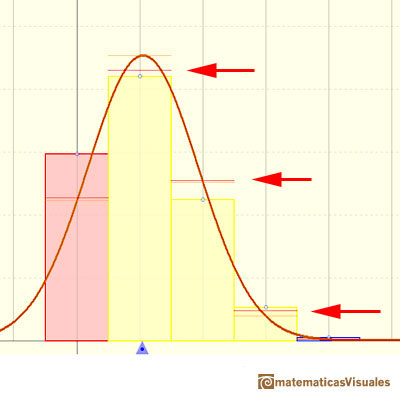
In the applet, when the absolute error of this normal approximation is less than 0.005 we draw a blue rectangle. If the approximation is between 0.005 and 0.05 we draw a yellow rectangle and if the approximation is less accurate the rectangle is red.
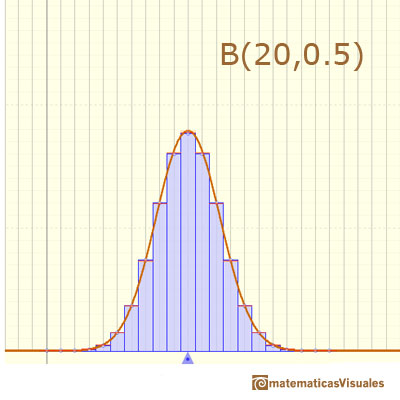
Here we can see a case where the approximation seems accurate:
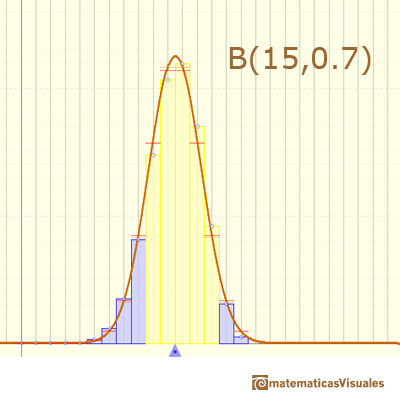
This approximation seems no so good:
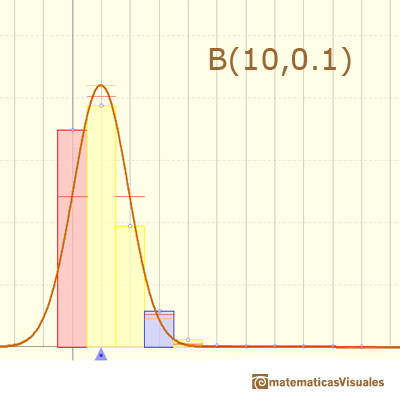
In the next case the approximation is not accurate:
In the applet we can change the parameter n.
The mean is represented by a triangle and it can be seen as a point of equilibrium. By dragging we can modify parameter p.
Changing these two parameters we can see how good the normal approximation is.
The red points control vertical and horizontal scales.
If n is large enough and p is "near" 0.5, then the skew of the distribution is not too great. In this case the normal distribution gives an excellent approximation. Because the normal approximation is not accurate for small values of n, there are several rules of thumb. For example, one is that we can use the normal approximation only if
The approximation generally improves as n increases and is better when p is not near 0 or 1.
Here we can see a typical example of the use of the normal tables to calculate probabilities in a Binomial distribution (using the correction for continuity adjustement)

With large n, exact calculations of a Binomial Distribution can be very time consuming. But using a table with the Normal Distribution is easy. Historically, it was the first use of the normal distribution, introduced by Abraham de Moivre.
REFERENCES
 NEXT
NEXT

 PREVIOUS

MORE LINKS


